WEATHER INFORMATION PAGE
APRS WEATHER STATION CURRENT DATA & TRENDS
REAL-TIME "WEATHERLINK" Brigham City
SUMMARY INCLUDING AIR QUALITY
Weatherlink Map showing Air Quality for the
Entire United States (Select Overlay/Air Quality on upper left-hand corner.)
Complete Weather Bulletin for K7UV/Brigham City, Utah

(MY DAVIS WEATHER STATION
CURRENT DATA at WEATHER
UNDERGROUND)
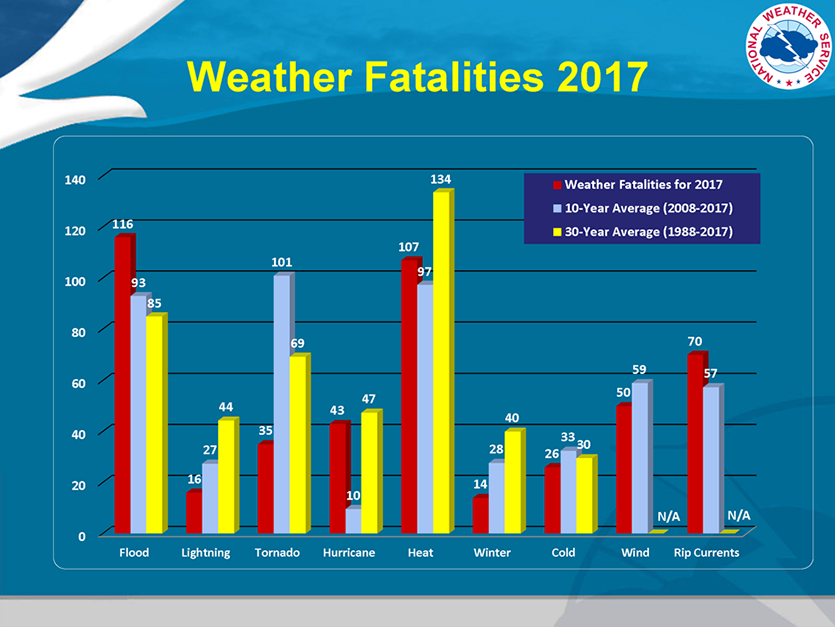
"Extreme heat and extreme cold both kill hundreds of people each year in the U.S., but determining a death toll for each is a process subject to large errors. In fact, two major U.S. government agencies that track heat and cold deaths--NOAA and the CDC--differ sharply in their answer to the question of which is the bigger killer. One reasonable take on the literature is that extreme heat and extreme cold are both likely responsible for at least 1300 deaths per year in the U.S. In cities containing 1/3 of the U.S. population, a warming climate is expected to increase the number of extreme temperature deaths by 3900 – 9300 per year by 2090, at a cost of $60 - $140 billion per year. However, acclimatization or other adaptation efforts, such as increased use of air conditioning, may cut these numbers by more than one-half."
**(The National Weather Service is an agency of the United States federal government that is tasked with providing weather forecasts, warnings of hazardous weather, and other weather-related products to organizations and the public for the purposes of protection, safety, and general information.)
CoCoRaHS CoCoRaHs officially began on June 17, 1998. With a few observers along Colorado's Front Range, we had no idea
that the network would become what it is today, with over 20,000 active observers in the United States and territories plus Canada. A truly remarkable effort by all of you. Please join us as we celebrate twenty years. Here's to many more on the horizon. To read about the past 20 years of CoCoRaHS by clicking here: History
No matter how many times we repeat this, the question just keeps coming up "who cares about and who uses the observations from CoCoRaHS volunteers?" It must be hard to fathom that precipitation data is so useful and that backyard rain gauges have a place of importance in national and global climate monitoring in the 21st Century. But the fact is, it’s true. Your rainfall reports -- including your reports of zero precipitation – are very valuable and are being used EVERY DAY. Every morning many organizations pull data from the CoCoRaHS database at least every hour to get all the latest reports as they come in. They wish all CoCoRaHS observers submitted their reports right away.
When you see forecasts of river stages and flood levels on the Missouri, the Mississippi, the Ohio, the Colorado River or most anywhere else in the country -- guess what data are helping the forecasters make these forecasts? Yes, timely CoCoRaHS data!
Your reports of hail or heavy rain may trigger the NWS to issue severe thunderstorm or flash flood warnings. In cases of extreme localized storms, your local report could help save lives.
Don’t let all this “importance” frighten you. The weight is not all on observers shoulders. The real value comes from having thousands of volunteers reporting from all over. So keep up the good work, and go out and find more weather enthusiasts to help measure, map and track the amazingly variable patterns of precipitation.
A key reason that CoCoRaHS data are so useful is because the rain gauge used by CoCoRaHS volunteers – the 4-inch diameter, 11.30” capacity clear plastic rain gauge is very good. Under most circumstances, this type of gauge performs as well as the official National Weather Service Standard Rain Gauge that has been used for over 120 years documenting our nation’s climate. Most CoCoRaHS volunteers have found representative locations to mount their gauge to get very high quality readings. The CoCoRaHS gauge, if installed and used properly, provides very accurate readings. CoCoRaHS volunteers tend to be very interested and very committed to careful and high-quality observations. As a result, the data are usually excellent for a wide range of uses.
Below are just a few of our many users, there are probably many others. The most obvious ones that come to mind are:
1. Weather Forecasters
2. Hydrologists
3. Water management
4. Researchers
5. Agriculture
6. Climatologists
7. Insurance Industry
8. Engineering
9. Recreation
10. Newspapers
11. Many others
How this data is used: